


S&P Dow Jones Indices: Record High Annual Home Price Gain Of 16.6% In May15314
Pages:
1
 WGAN Forum WGAN ForumFounder and Advisor Atlanta, Georgia |
DanSmigrod private msg quote post Address this user | |
| Media Release --- S&P CoreLogic Case-Shiller Index Reports Record High Annual Home Price Gain Of 16.6% In May 2021 NEW YORK, July 27, 2021 /PRNewswire/ -- S&P Dow Jones Indices (S&P DJI) today released the latest results for the S&P CoreLogic Case-Shiller Indices, the leading measure of U.S. home prices. Data released today for May 2021 show that home prices continue to increase across the U.S. More than 27 years of history are available for the data series, and can be accessed in full by going to https://www.spglobal.com/spdji/. YEAR-OVER-YEAR The S&P CoreLogic Case-Shiller U.S. National Home Price NSA Index, covering all nine U.S. census divisions, reported a 16.6% annual gain in May, up from 14.8% in the previous month. The 10-City Composite annual increase came in at 16.4%, up from 14.5% in the previous month. The 20-City Composite posted a 17.0% year-over-year gain, up from 15.0% in the previous month. Phoenix, San Diego, and Seattle reported the highest year-over-year gains among the 20 cities in May. Phoenix led the way with a 25.9% year-over-year price increase, followed by San Diego with a 24.7% increase and Seattle with a 23.4% increase. All 20 cities reported higher price increases in the year ending May 2021 versus the year ending April 2021. MONTH-OVER-MONTH Before seasonal adjustment, the U.S. National Index posted a 2.1% month-over-month increase in May, while the 10-City and 20-City Composites both posted increases of 1.9% and 2.1%, respectively. After seasonal adjustment, the U.S. National Index posted a month-over-month increase of 1.7%, and the 10-City and 20-City Composites both posted increases of 1.7% and 1.8%, respectively. In May, all 20 cities reported increases before and after seasonal adjustments. ANALYSIS "Housing price growth set a record for the second consecutive month in May 2021," says Craig J. Lazzara, Managing Director and Global Head of Index Investment Strategy at S&P DJI. "The National Composite Index marked its twelfth consecutive month of accelerating prices with a 16.6% gain from year-ago levels, up from 14.8% in April. This acceleration is also reflected in the 10- and 20-City Composites (up 16.4% and 17.0%, respectively). The market's strength continues to be broadly-based: all 20 cities rose, and all 20 gained more in the 12 months ended in May than they had gained in the 12 months ended in April. Prices in 18 of our 20 cities now stand at all-time highs, as do the National Composite and both the 10- and 20-City indices. "A month ago, I described April's performance as "truly extraordinary," and this month I find myself running out of superlatives. The 16.6% gain is the highest reading in more than 30 years of S&P CoreLogic Case-Shiller data. As was the case last month, five cities – Charlotte, Cleveland, Dallas, Denver, and Seattle – joined the National Composite in recording their all-time highest 12-month gains. Price gains in all 20 cities were in the top quartile of historical performance; in 17 cities, price gains were in top decile. "We have previously suggested that the strength in the U.S. housing market is being driven in part by reaction to the COVID pandemic, as potential buyers move from urban apartments to suburban homes. May's data continue to be consistent with this hypothesis. This demand surge may simply represent an acceleration of purchases that would have occurred anyway over the next several years. Alternatively, there may have been a secular change in locational preferences, leading to a permanent shift in the demand curve for housing. More time and data will be required to analyze this question. "Phoenix's 25.9% increase led all cities for the 24th consecutive month, with San Diego (+24.7%) and Seattle (+23.4%) close behind. As was the case last month, prices were strongest in the West (+19.9%) and Southwest (+19.8%), but every region logged double-digit gains." SUPPORTING DATA Table 1 below shows the housing boom/bust peaks and troughs for the three composites along with the current levels and percentage changes from the peaks and troughs. 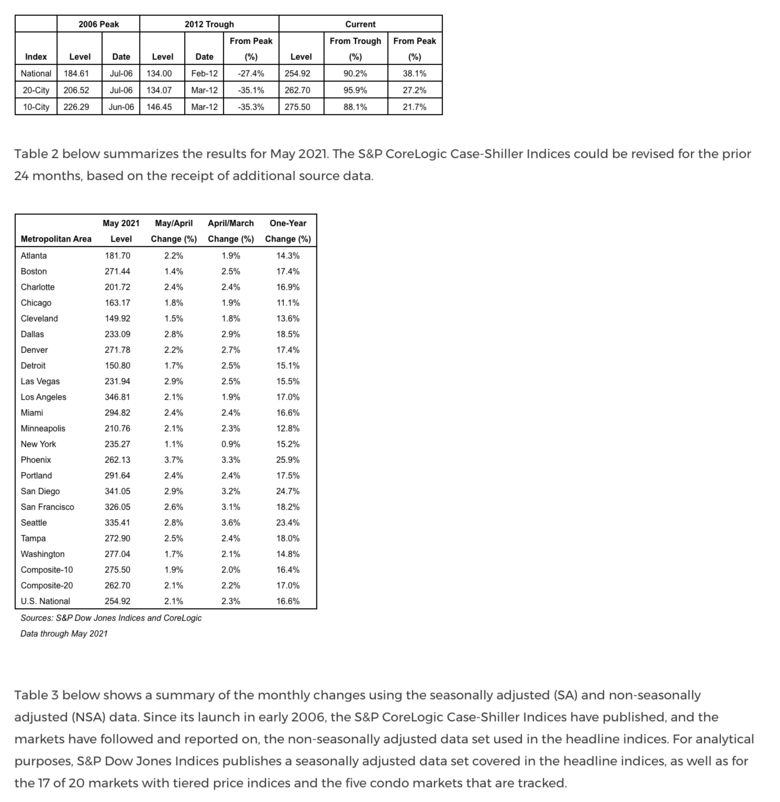 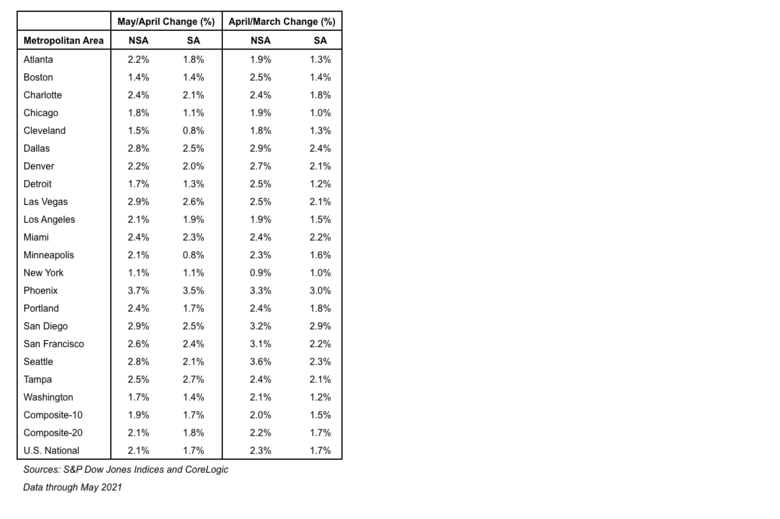 Source: S&P Dow Jones Indices via PRNewswire For more information about S&P Dow Jones Indices, please visit https://www.spglobal.com/spdji/. ABOUT S&P DOW JONES INDICES S&P Dow Jones Indices is the largest global resource for essential index-based concepts, data and research, and home to iconic financial market indicators, such as the S&P 500® and the Dow Jones Industrial Average®. More assets are invested in products based on our indices than products based on indices from any other provider in the world. Since Charles Dow invented the first index in 1884, S&P DJI has been innovating and developing indices across the spectrum of asset classes helping to define the way investors measure and trade the markets. S&P Dow Jones Indices is a division of S&P Global (NYSE: SPGI), which provides essential intelligence for individuals, companies, and governments to make decisions with confidence. For more information, visit https://www.spglobal.com/spdji/. Source: S&P Dow Jones Indices via PRNewswire |
||
| Post 1 • IP flag post | ||
Pages:
1This topic is archived. Start new topic?